Often tested
Population: from 4 million to 66 million
In 1600, when Elizabeth I was on the throne, the population of the UK was only a little over 4 million. By 2017 it had passed 66 million. Here is how it changed over these four hundred years:
Often tested
In 1600, when Elizabeth I was on the throne, the population of the UK was only a little over 4 million. By 2017 it had passed 66 million. Here is how it changed over these four hundred years:
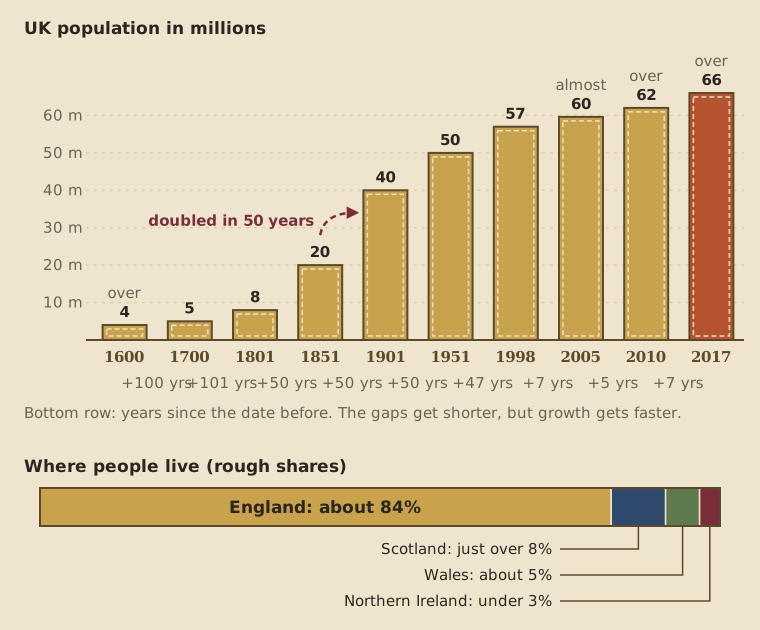
In recent years the population has grown faster than before. There are two reasons: people moving to the UK and people living longer.
People are spread very unevenly across the four nations. About 84% live in England, and that share has stayed much the same over time. Scotland has just over 8%, Wales about 5% and Northern Ireland under 3%.
People in Britain now live longer than at any time in history, because living standards and health care have both improved. There are more people aged 85 or older than ever before. That has a cost: more money is needed for pensions and health care.
Quiz
Roughly what share of the UK's population lives in England?
About 84% live in England, so the other three nations together have only about 16%: Scotland just over 8%, Wales about 5% and Northern Ireland under 3%.
Quiz
Is the statement below TRUE or FALSE? Because life expectancy in the UK is falling, the number of people aged 85 and over is lower than ever before.
False: it's the other way round. People in the UK now live longer than ever, and there are more people aged 85 and over than at any time before. This makes pensions and health care more expensive.
Quiz
Roughly what was the population of the UK in 1901?
About 40 million. In 1851 it was 20 million, so it doubled in fifty years. 8 million was the figure for 1801, and 57 million for 1998.
Quiz
Which TWO factors have helped the UK's population grow faster in recent years?
Migration into the UK and people living longer are the two reasons the population has grown faster in recent years. Life expectancy has actually gone up, and health care has got better, not worse, so B and D are the opposite of the facts.